Visualizing Web Map Tile Service (WMTS) Layers
At this time, there are two collections (AFLVIS2 and AfriSAR_UAVSAR_Coreg_SLC) for which we can visualize WMTS layers. WMTS layers can be visualized using the Common Mapping Client (CMC). The CMC is a starter-kit for web-based mapping applications which utilizes several common mapping funtionalities. This example demonstrates how to visualize WMTS layers using ipyCMC, a Jupyter Lab widget for the CMC.
First, we import the ipycmc package.
[1]:
# Import the ipycmc module
import ipycmc
We utilize the CMC widget to visualize data in the MAAP Algorithm Development Environment (ADE).
[2]:
# utilize the CMC widget
w = ipycmc.MapCMC()
w
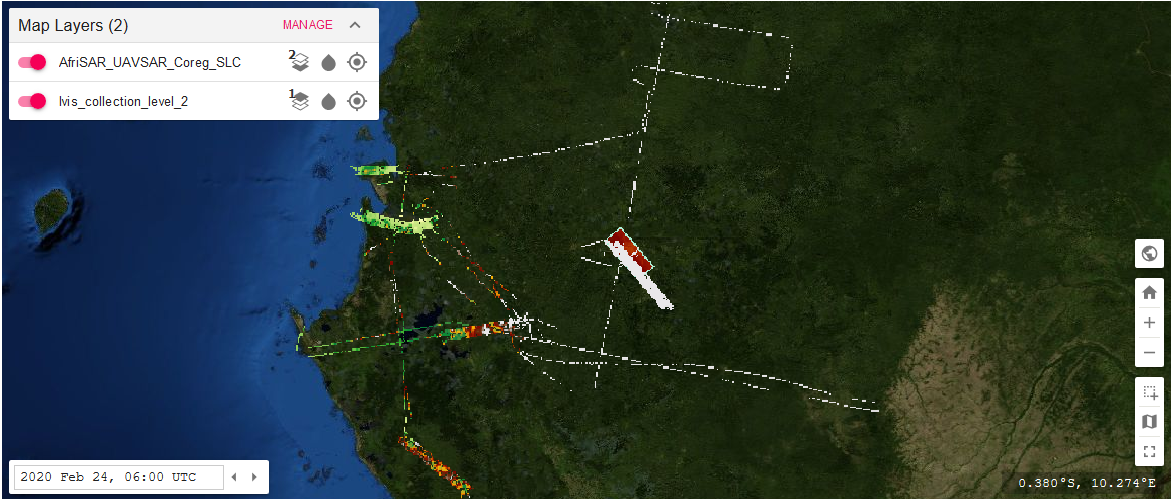
The CMC user interface provides a variety of tools for analyzing data. In the top left corner, the Map Layers drop-down menu allows us to turn map layers on and off and provides tools for managing layer positioning, setting layer opacity, and zooming to a layer. At the lower right end of the display are tools for displaying the data, adjusting the zoom level, and selecting data. The ‘Switch to 3D map’ button allows us to switch between 2D and 3D maps. The ‘Home’ button zooms to the global extent and the ‘Zoom In’ and ‘Zoom Out’ buttons zoom the data to appear nearer or farther away. The ‘Select Area’ button allows us to select an area using a variety of geometrical methods, the ‘Select Basemap’ button allows us to select from a list of available basemaps, and the ‘Fullscreen’ button toggles full screen mode. At the bottom right, the cursor location on the map is displayed in Latitude/Longitude decimal degrees. At the bottom left of the user interface, there is a text box allowing us to change the date and time and arrows to change the day.
Visualizing Collections
To visualize the available collections, we utilize the load_layer_config() function, handling the url as a WMTS xml file.
[5]:
# visualize the available set of layers
w.load_layer_config("https://api.maap-project.org/api/wmts/GetCapabilities", "wmts/xml")
Once the layers load, the number displayed in the Map Layers drop-down menu should increase. Pressing the downward arrow on the drop-down menu displays the loaded layers. Turn the layers on and off by pressing the toggle to the left of the layer names and zoom to a layer by pressing the crosshair button.
Visualizing Single Granules
We can also visualize a single granule which is within one of the available collections by using the granule UR with the load_layer_config() function and handling the url as a WMTS file.
[6]:
# visualize a single granule using the granule UR
w.load_layer_config("https://api.maap-project.org/api/wmts/GetCapabilities?short_name=AFLVIS2&granule_ur=SC:AFLVIS2.001:138348905", "wmts/xml")
This example here shows how we can add a layer by providing a granule UR. These granule URs can be extracted from the metadata by searching using CMR and the MAAP API. Please see the search granule example for specifics on how to search for granules and extract the UR - https://docs.maap-project.org/en/latest/technical_tutorials/search/granules.html.