GEDI_L4B Search and Visualize
Authors: Nikita Susan (UAH), Aimee Barciauskas (Development Seed), Sumant Jha (MSFC/USRA), Alex Mandel (Development Seed)
Date: April 7, 2023
Description: In this example, we demonstrate how to access the GEDI L4B collection and granule data on the MAAP ADE, and then visualize the data using matplotlib.
Run This Notebook
To access and run this tutorial within MAAP’s Algorithm Development Environment (ADE), please refer to the “Getting started with the MAAP” section of our documentation.
Disclaimer: it is highly recommended to run a tutorial within MAAP’s ADE, which already includes packages specific to MAAP, such as maap-py. Running the tutorial outside of the MAAP ADE may lead to errors.
About the Data
GEDI L4B Gridded Aboveground Biomass Density, Version 2
This dataset provides Global Ecosystem Dynamics Investigation (GEDI) Level 4 (L4) data, which has the purpose of providing mean aboveground biomass density (AGBD) and consists of the GEDI_L4A and GEDI_L4B collections. GEDI_L4B uses a sample present within each 1km cell to statistically infer mean AGBD. GEDI is attached to the International Space Station (ISS) and collects data globally between 51.6° N and 51.6° S latitudes at the highest resolution and densest sampling of any light detection and ranging (lidar) instrument in orbit to date; specifically, GEDI L4B data has a spatial resolution of 1km. (Source: GEDI_L4B Version 2 User Guide)
Additional Resources
Importing Packages
Within your Jupyter Notebook, start by importing the maap package. Then invoke the MAAP constructor, setting the maap_host argument to ‘api.maap-project.org’.
[22]:
from maap.maap import MAAP
from matplotlib import pyplot
import os
import pprint
import rasterio
import boto3

maap = MAAP(maap_host="api.maap-project.org")
Search for the Collection and Associated Granules
Now, we will search for the collection using the collection short name:
[23]:
collection = maap.searchCollection(cmr_host='cmr.earthdata.nasa.gov', short_name="GEDI_L4B_Gridded_Biomass_2017", limit=100)
print(collection)
[{'concept-id': 'C2244602422-ORNL_CLOUD', 'revision-id': '7', 'format': 'application/echo10+xml', 'Collection': {'ShortName': 'GEDI_L4B_Gridded_Biomass_2017', 'VersionId': '2', 'InsertTime': '2022-03-29T00:00:00Z', 'LastUpdate': '2023-06-12T20:25:17Z', 'LongName': 'GEDI L4B Gridded Aboveground Biomass Density, Version 2', 'DataSetId': 'GEDI L4B Gridded Aboveground Biomass Density, Version 2', 'Description': "This Global Ecosystem Dynamics Investigation (GEDI) L4B product provides 1 km x 1 km (1 km, hereafter) estimates of mean aboveground biomass density (AGBD) based on observations from mission week 19 starting on 2019-04-18 to mission week 138 ending on 2021-08-04. The GEDI L4A Footprint Biomass product converts each high-quality waveform to an AGBD prediction, and the L4B product uses the sample present within the borders of each 1 km cell to statistically infer mean AGBD. The gridding procedure is described in the GEDI L4B Algorithm Theoretical Basis Document (ATBD). Patterson et al. (2019) describes the hybrid model-based mode of inference used in the L4B product. Corresponding 1 km estimates of the standard error of the mean are also provided in the L4B product. Uncertainty is due to both GEDI's sampling of the 1 km area (as opposed to making wall-to-wall observations) and the fact that L4A biomass values are modeled in a process subject to error instead of measured in a process that may be assumed to be error-free.", 'DOI': {'DOI': '10.3334/ORNLDAAC/2017', 'Authority': 'https://doi.org'}, 'Orderable': 'false', 'Visible': 'true', 'RevisionDate': '2022-03-29T00:00:00Z', 'ProcessingLevelId': '4', 'ProcessingLevelDescription': 'model products', 'ArchiveCenter': 'ORNL_DAAC', 'CitationForExternalPublication': 'Dubayah, R.O., J. Armston, S.P. Healey, Z. Yang, P.L. Patterson, S. Saarela, G. Stahl, L. Duncanson, and J.R. Kellner. 2022. GEDI L4B Gridded Aboveground Biomass Density, Version 2. ORNL DAAC, Oak Ridge, Tennessee, USA. https://doi.org/10.3334/ORNLDAAC/2017', 'CollectionState': 'COMPLETE', 'MaintenanceAndUpdateFrequency': 'As needed', 'UseConstraints': {'LicenseURL': {'URL': 'https://science.nasa.gov/earth-science/earth-science-data/data-information-policy', 'Description': 'License URL for data use policy', 'Type': 'Data Use Policy', 'MimeType': 'text/html'}}, 'Price': '0', 'DataFormat': 'GeoTIFF', 'SpatialKeywords': {'Keyword': 'GLOBAL LAND'}, 'Temporal': {'RangeDateTime': {'BeginningDateTime': '2019-04-18T00:00:00Z', 'EndingDateTime': '2021-08-04T23:59:59Z'}}, 'Contacts': {'Contact': {'Role': 'ARCHIVER', 'OrganizationName': 'ORNL_DAAC', 'OrganizationAddresses': {'Address': {'StreetAddress': 'ORNL DAAC User Services Office, P.O. Box 2008, MS 6407, Oak Ridge National Laboratory', 'City': 'Oak Ridge', 'StateProvince': 'Tennessee', 'PostalCode': '37831-6407', 'Country': 'USA'}}, 'OrganizationPhones': {'Phone': {'Number': '(865) 241-3952', 'Type': 'Direct Line'}}, 'OrganizationEmails': {'Email': 'uso@daac.ornl.gov'}}}, 'ScienceKeywords': {'ScienceKeyword': [{'CategoryKeyword': 'EARTH SCIENCE', 'TopicKeyword': 'BIOSPHERE', 'TermKeyword': 'ECOSYSTEMS', 'VariableLevel1Keyword': {'Value': 'TERRESTRIAL ECOSYSTEMS'}}, {'CategoryKeyword': 'EARTH SCIENCE', 'TopicKeyword': 'BIOSPHERE', 'TermKeyword': 'VEGETATION', 'VariableLevel1Keyword': {'Value': 'BIOMASS'}}, {'CategoryKeyword': 'EARTH SCIENCE', 'TopicKeyword': 'SPECTRAL/ENGINEERING', 'TermKeyword': 'LIDAR', 'VariableLevel1Keyword': {'Value': 'LIDAR WAVEFORM'}}]}, 'Platforms': {'Platform': {'ShortName': 'ISS', 'LongName': 'MUSES', 'Type': 'Space Stations/Crewed Spacecraft', 'Instruments': {'Instrument': {'ShortName': 'GEDI', 'LongName': 'Global Ecosystem Dynamics Investigation'}}}}, 'Campaigns': {'Campaign': {'ShortName': 'GEDI', 'LongName': 'Global Ecosystem Dynamics Investigation'}}, 'OnlineAccessURLs': {'OnlineAccessURL': {'URL': 'https://daac.ornl.gov/gedi/GEDI_L4B_Gridded_Biomass/', 'URLDescription': 'This link allows direct data access via Earthdata login'}}, 'OnlineResources': {'OnlineResource': [{'URL': 'https://daac.ornl.gov/GEDI/guides/GEDI_L4B_Gridded_Biomass.html', 'Description': 'ORNL DAAC Data Set Documentation', 'Type': "USER'S GUIDE"}, {'URL': 'https://doi.org/10.3334/ORNLDAAC/2017', 'Description': 'Data set Landing Page DOI URL', 'Type': 'DATA SET LANDING PAGE'}, {'URL': 'https://data.ornldaac.earthdata.nasa.gov/public/gedi/GEDI_L4B_Gridded_Biomass/comp/GEDI_L4B_ATBD_v1.0.pdf', 'Description': 'GEDI L4B Gridded Aboveground Biomass Density, Version 2: GEDI_L4B_ATBD_v1.0.pdf', 'Type': 'GENERAL DOCUMENTATION'}, {'URL': 'https://data.ornldaac.earthdata.nasa.gov/public/gedi/GEDI_L4B_Gridded_Biomass/comp/GEDI_L4B_Gridded_Biomass.pdf', 'Description': 'GEDI L4B Gridded Aboveground Biomass Density, Version 2: GEDI_L4B_Gridded_Biomass.pdf', 'Type': 'GENERAL DOCUMENTATION'}, {'URL': 'https://daac.ornl.gov/GEDI/guides/GEDI_L4B_Gridded_Biomass_Fig1.png', 'Description': 'Gridded mean aboveground biomass density (top) and standard error of the mean (bottom).', 'Type': 'GET RELATED VISUALIZATION', 'MimeType': 'image/png'}, {'URL': 'https://gedi.umd.edu', 'Description': 'GEDI Project Site', 'Type': 'PROJECT HOME PAGE', 'MimeType': 'text/html'}, {'URL': 'https://webmap.ornl.gov/wcsdown/dataset.jsp?ds_id=2017', 'Description': 'Web Coverage Service for this collection.', 'Type': 'WEB COVERAGE SERVICE (WCS)', 'MimeType': 'application/gml+xml'}]}, 'Spatial': {'SpatialCoverageType': 'HORIZONTAL', 'HorizontalSpatialDomain': {'Geometry': {'CoordinateSystem': 'CARTESIAN', 'BoundingRectangle': {'WestBoundingCoordinate': '-180.00', 'NorthBoundingCoordinate': '52.00', 'EastBoundingCoordinate': '180.00', 'SouthBoundingCoordinate': '-52.00'}}}, 'GranuleSpatialRepresentation': 'CARTESIAN'}, 'DirectDistributionInformation': {'Region': 'us-west-2', 'S3BucketAndObjectPrefixName': 's3://ornl-cumulus-prod-protected/gedi/GEDI_L4B_Gridded_Biomass/', 'S3CredentialsAPIEndpoint': 'https://data.ornldaac.earthdata.nasa.gov/s3credentials', 'S3CredentialsAPIDocumentationURL': 'https://data.ornldaac.earthdata.nasa.gov/s3credentialsREADME'}}}]
Next, we can search for granules using the searchGranule function and the concept ID from our collection search above:
[24]:
COLLECTIONID = collection[0]['concept-id']
results = maap.searchGranule(cmr_host='cmr.earthdata.nasa.gov',concept_id=COLLECTIONID)  # COLLECTIONID 'C2244602422-ORNL_CLOUD'
print(f'Got {len(results)} results')
results[0]['Granule']
Got 10 results
[24]:
{'GranuleUR': 'GEDI_L4B_Gridded_Biomass.GEDI04_B_MW019MW138_02_002_05_R01000M_PS.tif',
 'InsertTime': '2022-03-29T00:00:00Z',
 'LastUpdate': '2023-04-10T21:58:24Z',
 'Collection': {'ShortName': 'GEDI_L4B_Gridded_Biomass_2017',
  'VersionId': '2'},
 'DataGranule': {'DataGranuleSizeInBytes': '20103343',
  'SizeMBDataGranule': '20.103343',
  'Checksum': {'Value': '025a141348906d5e612262218c496a2d468446ca30875439be6651d851bfbe23',
   'Algorithm': 'SHA-256'},
  'DayNightFlag': 'BOTH',
  'ProductionDateTime': '2022-03-29T00:00:00Z'},
 'Temporal': {'RangeDateTime': {'BeginningDateTime': '2019-04-18T00:00:00Z',
   'EndingDateTime': '2021-08-04T23:59:59Z'}},
 'Spatial': {'HorizontalSpatialDomain': {'Geometry': {'BoundingRectangle': {'WestBoundingCoordinate': '-180',
     'NorthBoundingCoordinate': '52',
     'EastBoundingCoordinate': '180',
     'SouthBoundingCoordinate': '-52'}}}},
 'MeasuredParameters': {'MeasuredParameter': [{'ParameterName': 'LIDAR WAVEFORM'},
   {'ParameterName': 'BIOMASS'},
   {'ParameterName': 'TERRESTRIAL ECOSYSTEMS'}]},
 'Platforms': {'Platform': {'ShortName': 'ISS',
   'Instruments': {'Instrument': {'ShortName': 'GEDI'}}}},
 'Campaigns': {'Campaign': {'ShortName': 'GEDI'}},
 'Price': '0',
 'OnlineAccessURLs': {'OnlineAccessURL': [{'URL': 'https://data.ornldaac.earthdata.nasa.gov/protected/gedi/GEDI_L4B_Gridded_Biomass/data/GEDI04_B_MW019MW138_02_002_05_R01000M_PS.tif',
    'URLDescription': 'Download GEDI04_B_MW019MW138_02_002_05_R01000M_PS.tif',
    'MimeType': 'image/tiff'},
   {'URL': 'https://data.ornldaac.earthdata.nasa.gov/public/gedi/GEDI_L4B_Gridded_Biomass/data/GEDI04_B_MW019MW138_02_002_05_R01000M_PS.tif.sha256',
    'URLDescription': 'Download GEDI04_B_MW019MW138_02_002_05_R01000M_PS.tif.sha256'},
   {'URL': 's3://ornl-cumulus-prod-protected/gedi/GEDI_L4B_Gridded_Biomass/data/GEDI04_B_MW019MW138_02_002_05_R01000M_PS.tif',
    'URLDescription': 'This link provides direct download access via S3 to the granule',
    'MimeType': 'image/tiff'}]},
 'OnlineResources': {'OnlineResource': [{'URL': 'https://daac.ornl.gov/GEDI/guides/GEDI_L4B_Gridded_Biomass.html',
    'Description': 'ORNL DAAC Data Set Documentation',
    'Type': "USER'S GUIDE"},
   {'URL': 'https://doi.org/10.3334/ORNLDAAC/2017',
    'Description': 'Data set Landing Page DOI URL',
    'Type': 'DATA SET LANDING PAGE'},
   {'URL': 'https://daac.ornl.gov/daacdata/gedi/GEDI_L4B_Gridded_Biomass/comp/GEDI_L4B_ATBD_v1.0.pdf',
    'Description': 'Data Set Documentation',
    'Type': 'GENERAL DOCUMENTATION'},
   {'URL': 'https://daac.ornl.gov/daacdata/gedi/GEDI_L4B_Gridded_Biomass/comp/GEDI_L4B_Gridded_Biomass.pdf',
    'Description': 'Data Set Documentation',
    'Type': 'GENERAL DOCUMENTATION'},
   {'URL': 'https://webmap.ornl.gov/sdat/pimg/2017_9.png',
    'Description': 'GEDI L4B Gridded Prediction Stratum, Version 2, Mission Weeks 19-138',
    'Type': 'BROWSE',
    'MimeType': 'image/png'},
   {'URL': 'https://data.ornldaac.earthdata.nasa.gov/s3credentials',
    'Description': 'api endpoint to retrieve temporary credentials valid for same-region direct s3 access',
    'Type': 'VIEW RELATED INFORMATION'}]},
 'Orderable': 'false',
 'DataFormat': 'COG'}
Accessing and Downloading the Granule from ORNL DAAC S3
Before downloading, we’ll get the collection and file name:
[25]:
granule_ur=results[0]['Granule']['GranuleUR'].split(".")
collection_name=granule_ur[0]
file_name=granule_ur[1]

print(collection_name)
print(file_name)
GEDI_L4B_Gridded_Biomass
GEDI04_B_MW019MW138_02_002_05_R01000M_PS
Now we’ll proceed to get tempory s3 credentials, and then download the tif file to our workspace:
[ ]:
def get_s3_creds(url):
    return maap.aws.earthdata_s3_credentials(url)

def get_s3_client(s3_cred_endpoint):
    creds=get_s3_creds(s3_cred_endpoint)
    boto3_session = boto3.Session(
            aws_access_key_id=creds['accessKeyId'],
            aws_secret_access_key=creds['secretAccessKey'],
            aws_session_token=creds['sessionToken']
    )
    return boto3_session.client("s3")

def download_s3_file(s3, bucket, collection_name, file_name):
    os.makedirs("/home/jovyan/gedi_l4b", exist_ok=True) # create directories, as necessary
    download_path=f"/home/jovyan/gedi_l4b/{file_name}.tif"
    s3.download_file(bucket, f"gedi/{collection_name}/data/{file_name}.tif", download_path)
    return download_path
[27]:
s3_cred_endpoint= 'https://data.ornldaac.earthdata.nasa.gov/s3credentials'
s3=get_s3_client(s3_cred_endpoint)
[1]:
bucket="ornl-cumulus-prod-protected"
download_path=download_s3_file(s3, bucket, collection_name, file_name)
download_path
[1]:
'/home/jovyan/gedi_l4b/GEDI04_B_MW019MW138_02_002_05_R01000M_PS.tif'
Open the local file using rasterio, and print the shape of the data to verify if the file was read properly:
[29]:
src = rasterio.open(download_path)
data = src.read(1)

print(data.shape)
(14616, 34704)
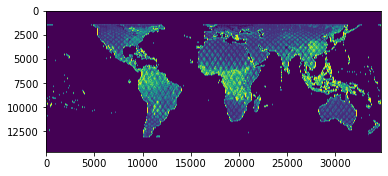
Plot the Data
Finally, we’ll use matplotlib to visualize our .tif file:
[30]:
pyplot.imshow(data)
pyplot.show()