Visualizing STAC Data Layers using stac_ipyleaflet (beta)
Authors: Emma Paz (Development Seed)
Date: May 10, 2023
Description: This project - stac_ipyleafet - leverages the ipyleaflet mapping library and is intended to reduce the code needed to visualize data from the MAAP STAC. The beta version supports Cloud-Optimized GeoTIFFs (COGs).
Currently, this package works within this Algorithm Development Environment.
Run This Notebook
To access and run this tutorial within MAAP’s Algorithm Development Environment (ADE), please refer to the “Getting started with the MAAP” section of our documentation.
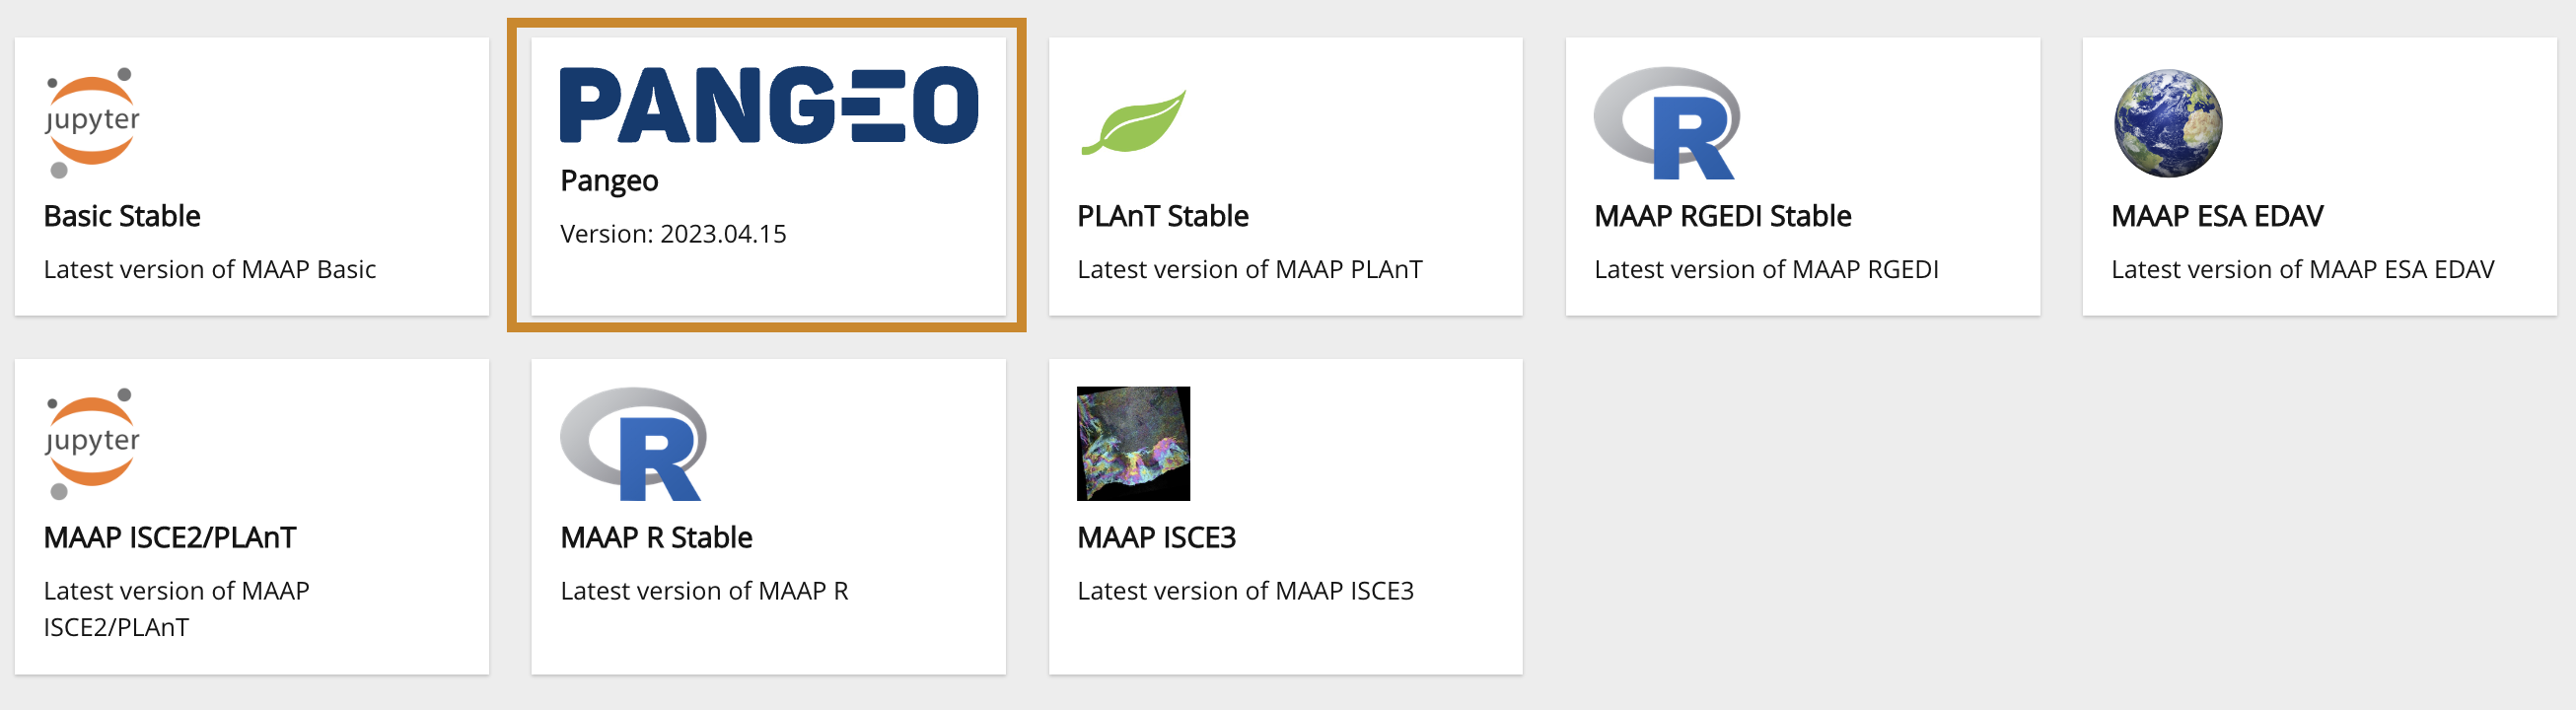
Disclaimer: it is recommended to run this tutorial within MAAP’s ADE Pangeo workspace, which already includes the stac_ipyleaflet package.
Additional Resources
stac_ipyleafet DOI: 10.5281/zenodo.10015863
Importing and Installing Packages
Selecting a new PANGEO workspace
or alternatively, you may install stac_ipyleaflet into your environment by uncommenting the install in the following cell:
[1]:
# NOTE: This has only been tested in the **MAAP Basic Stable (Vanilla)** environment.

# %pip install git+https://github.com/MAAP-Project/stac_ipyleaflet.git#egg-info=stac_ipyleaflet
[ ]:
import stac_ipyleaflet
m = stac_ipyleaflet.StacIpyleaflet()
m
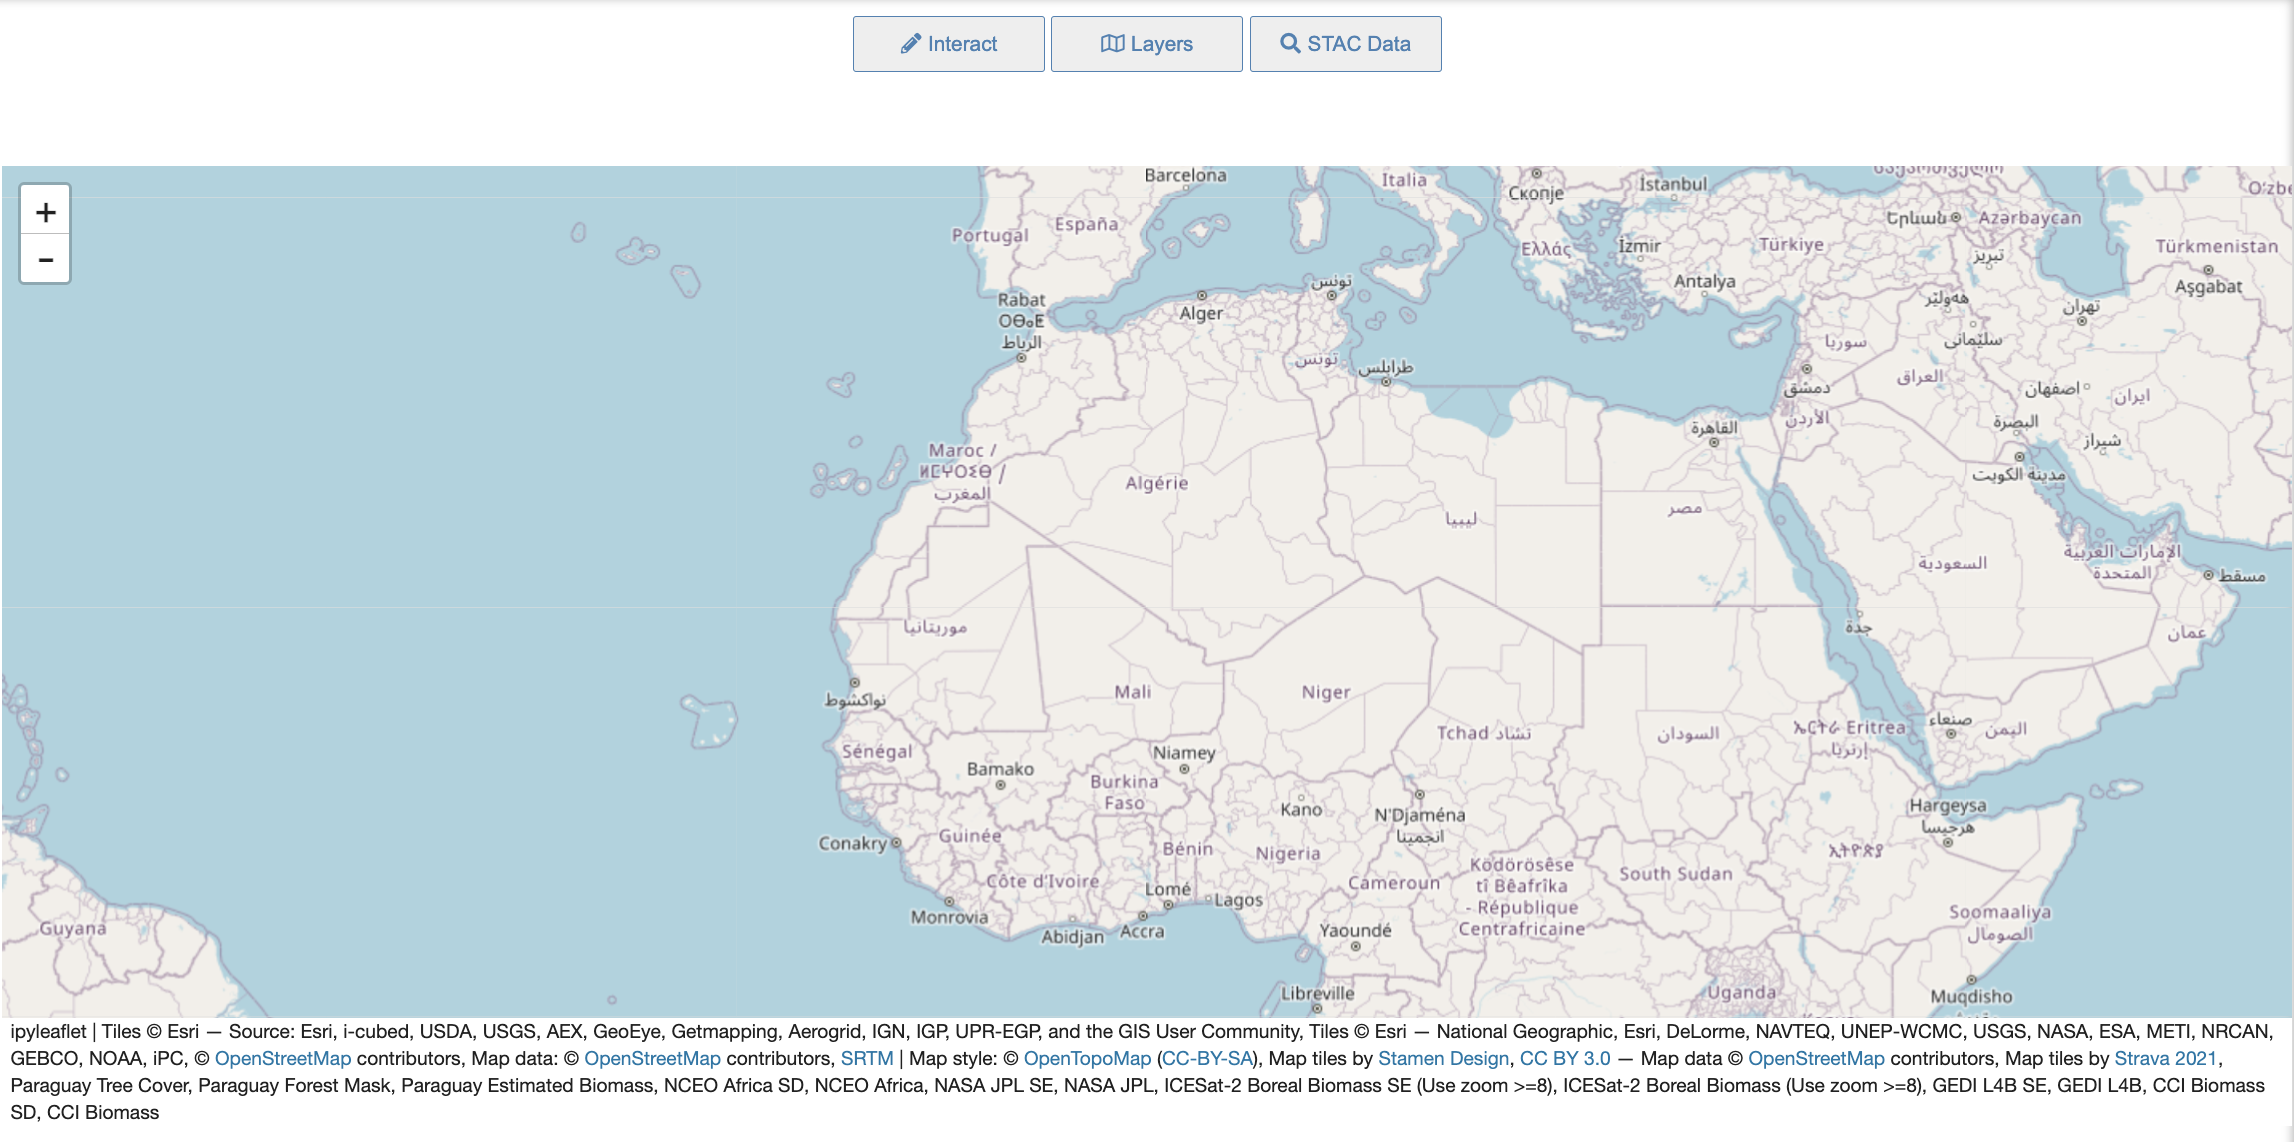
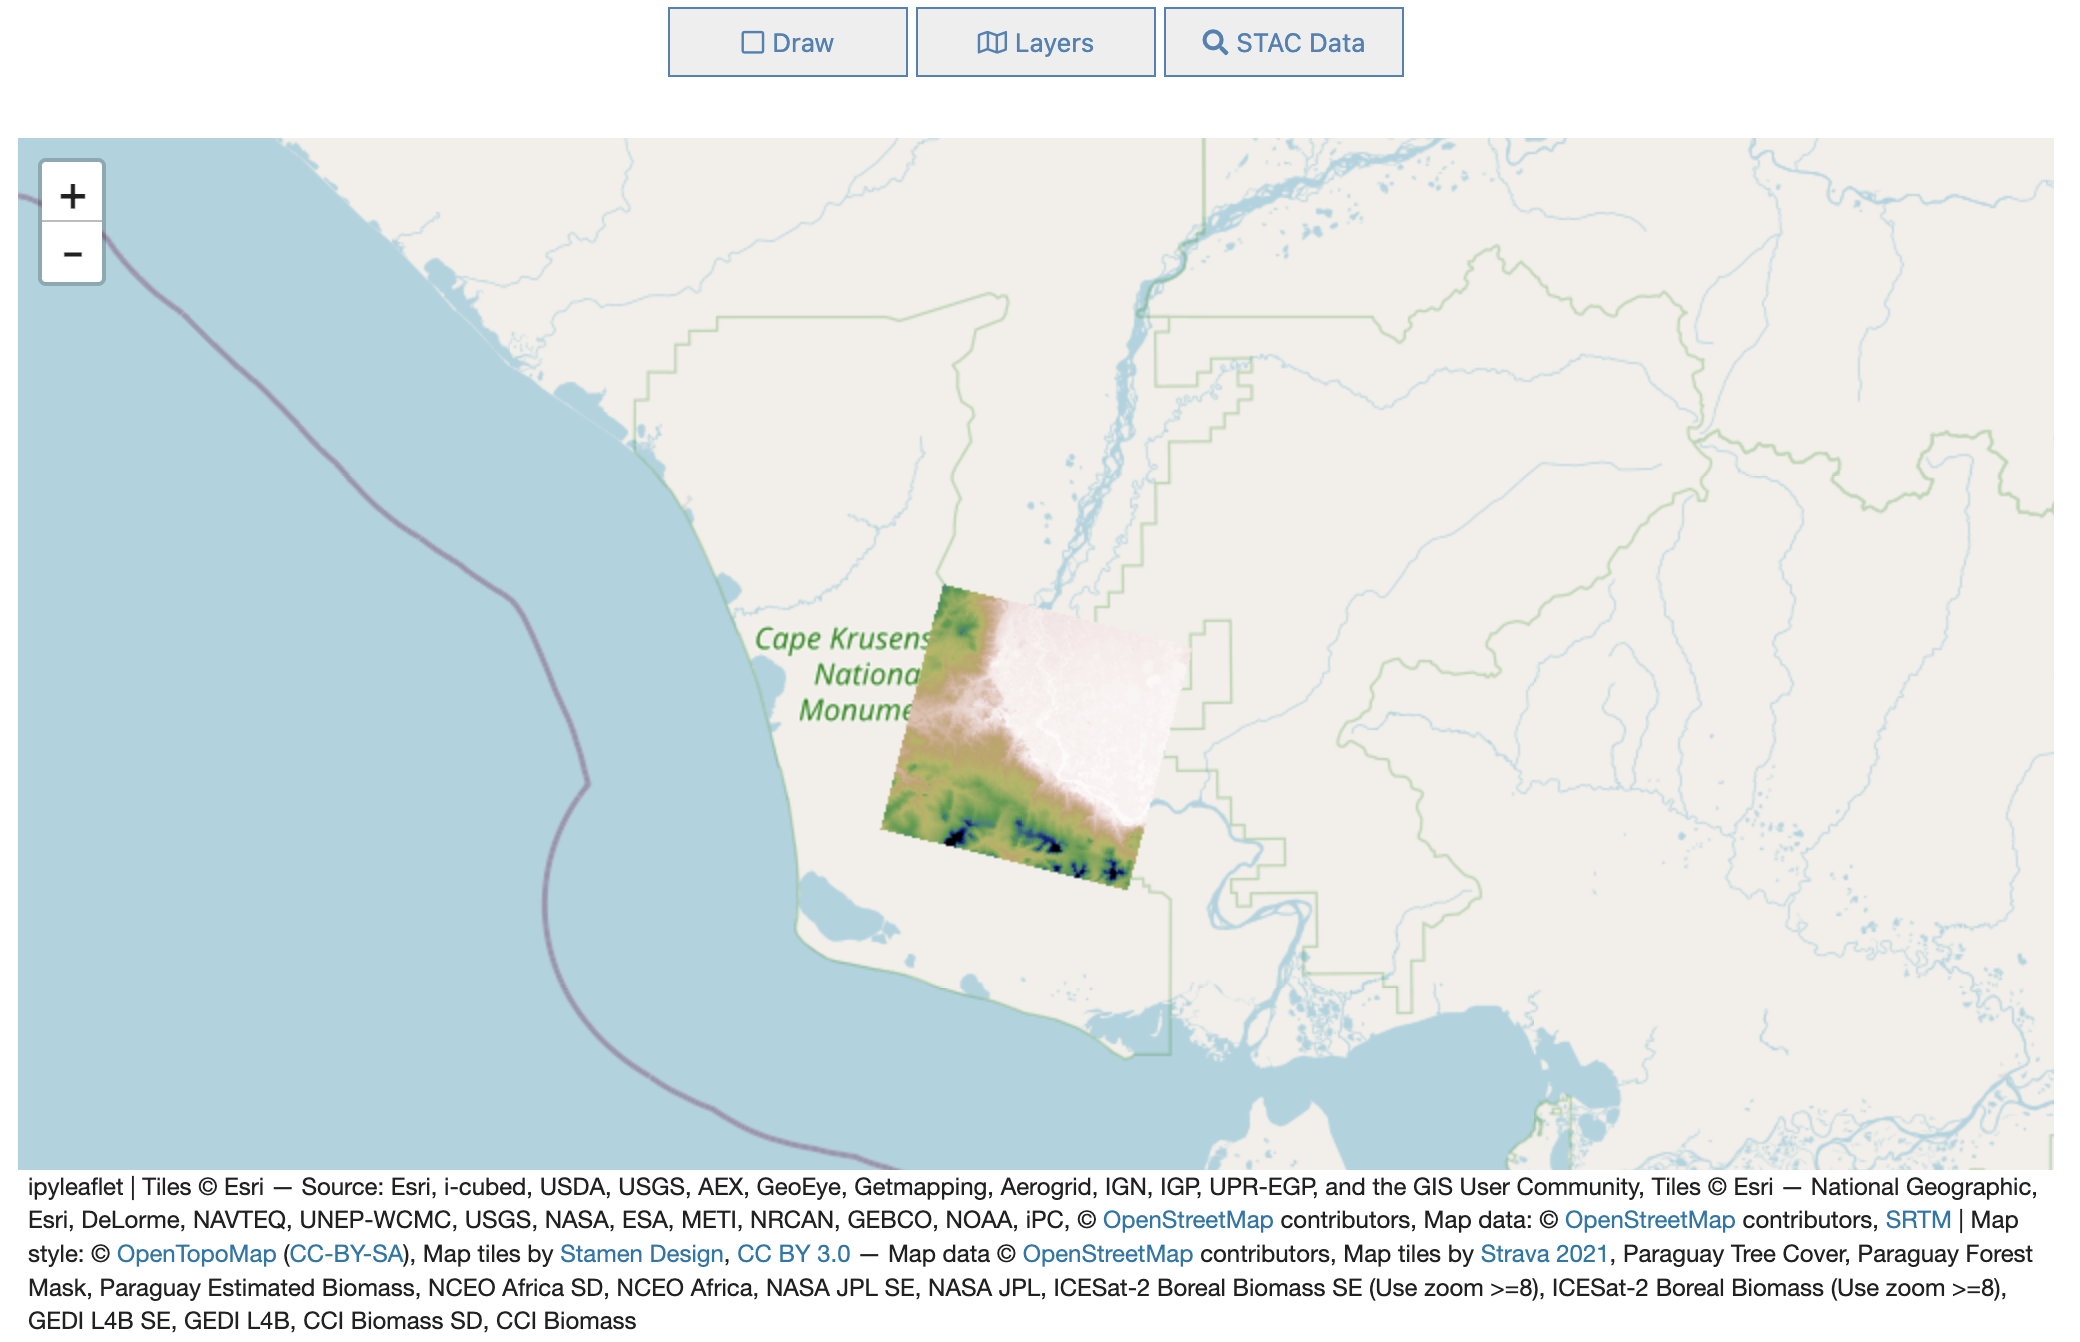
The stac ipyleaflet notebook’s user interface consists of a map and a custom set of tools to aid in the discovery and visualization of STAC datasets, along with Biomass Layers and pre-determined Basemaps.
Layers Tool
Pressing the Layers button at the top opens the Layers widget that consists of 2 tabs. This tool currently allows users to:
View one or more Biomass Layers at the same time to see different combinations.
Choose between common Basemap Layers that are known favorites.
Have full control over the opacity of any layer or basemap for fine-tuning how the map looks.
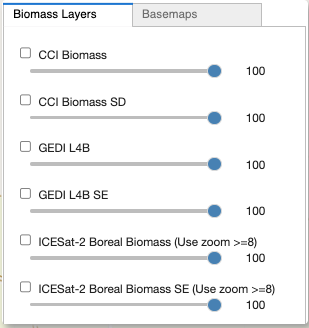
The Layers Tab
Toggle each layer’s visibility by using its checkbox
Adjust each layer’s opacity by moving its slider
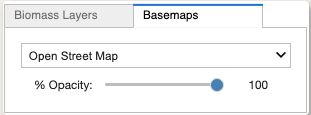
The Basemaps Tab
Select a basemap from the dropdown
Adjust the basemap’s opacity by moving its slider
STAC Discovery Tool
Pressing the STAC Data button at the top opens the STAC widget that consists of 2 tabs. This tool currently allows users to:
Connect to the MAAP STAC to access collections of mission data.
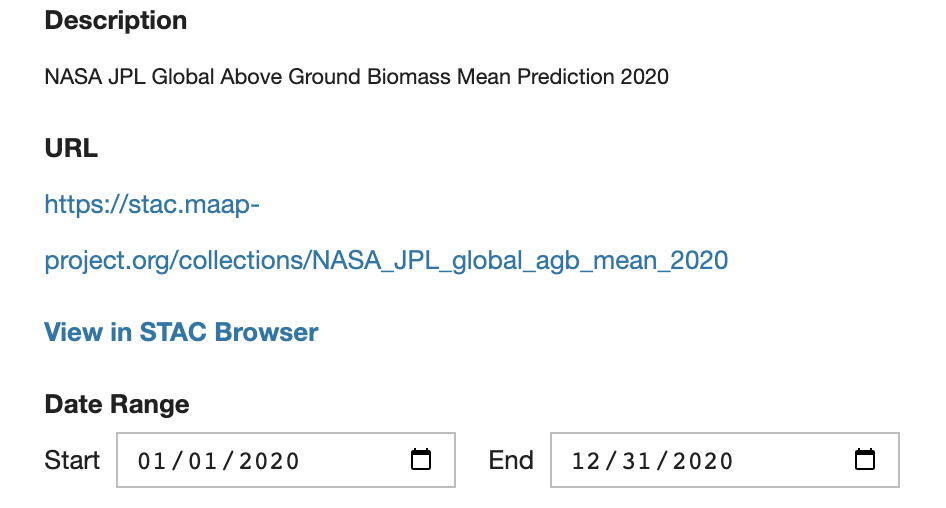
Discover items per the selected collection, including description, available dates, & direct URL.
Identify valid COG datasets.
Add COG tiles dynamically to the map.
Customize the tiles by changing the selected color palette for the selected item.
The Catalog Data Discovery Tab
Select a Collection within the default STAC library.
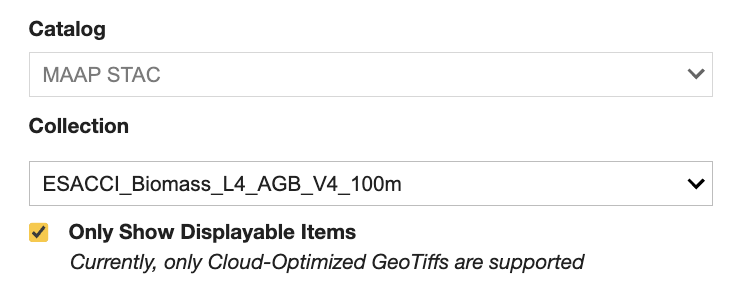
Browse through the Collection’s details.
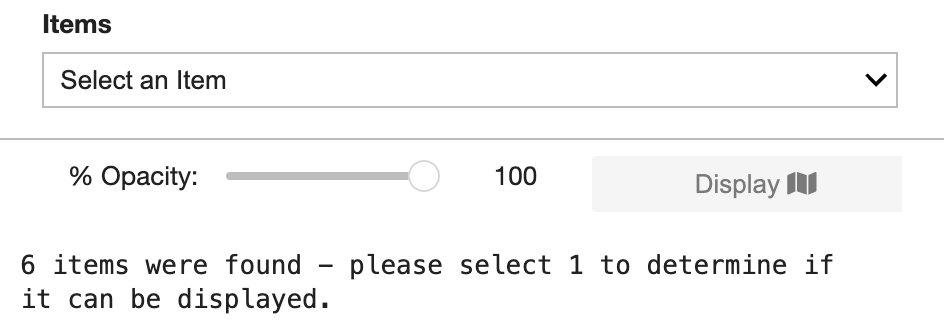
Select an item from the collection to check if it is a valid COG. If it is, the Display button will become active (available) to add the selected item to the map. The displayed STAC layer’s opacity can be adjusted by moving its slider.
The Visualization Tab
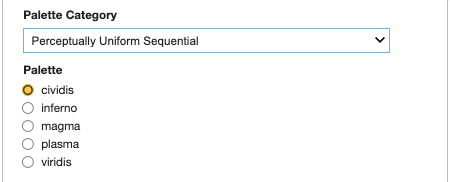
Select a category from the dropdown.
Select an item from the corresponding color palettes.
Press the Display button to update the data on the map.
Interact with the Map
Activate the Interact Tools (click on the top Interact button)
From within the
Pointtab: Use your mouse to activate the Point tool; then click on the map at a location of interestCoordinates will be printed within the open tab
Raster cell values will be identified and printed, if raster layers are on
From within the
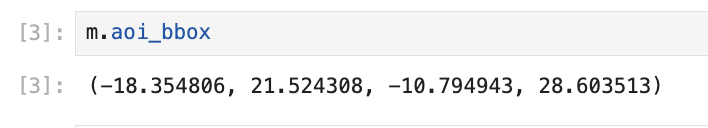
Areatab: Use your mouse to activate the Polygon tool; then click, hold and draw a polygon over the map - releasing to finishThe area of interest’s Coordinates & BBox within the open tab
Alternatively Print the area of interest’s bbox from within a cell:
Clear the point or polygon graphics as needed
Add a Tile Layer
[3]:
import httpx
import json
titiler_url = "https://titiler.maap-project.org"  # MAAP titiler endpoint
titiler_tilejson_url = f"{titiler_url}/cog/tilejson.json"
band_min = 0
band_max = 400
bidx = 1
colormap_name = 'gist_earth_r'
data_url = f"s3://maap-ops-workspace/shared/alexdevseed/landsat8/viz/Copernicus_30439_covars_cog_topo_stack.tif"
[8]:
from ipyleaflet import TileLayer

params = {
    "url": data_url,
    "bidx": bidx,
    "rescale": f"{band_min}, {band_max}",
    "pixel_selection": "first",
    "resampling_method": "nearest",
    "colormap_name": colormap_name
}
r = httpx.get(titiler_tilejson_url, params = params).json()

custom_layer = TileLayer(url=r["tiles"][0], show_loading=True, visible=True)
# print(custom_layer)
TileLayer(options=['attribution', 'bounds', 'detect_retina', 'max_native_zoom', 'max_zoom', 'min_native_zoom', 'min_zoom', 'no_wrap', 'tile_size', 'tms', 'zoom_offset'], show_loading=True, url='https://titiler.maap-project.org/cog/tiles/WebMercatorQuad/{z}/{x}/{y}@1x?url=s3%3A%2F%2Fmaap-ops-workspace%2Fshared%2Falexdevseed%2Flandsat8%2Fviz%2FCopernicus_30439_covars_cog_topo_stack.tif&bidx=1&rescale=0%2C+400&pixel_selection=first&resampling_method=nearest&colormap_name=gist_earth_r')
[9]:
r = httpx.get(
    f"{titiler_url}/cog/info",
    params = {
        "url": data_url,
    }
).json()

# print(json.dumps(r, indent=4))

bounds = r.get("bounds")
minzoom = r.get("minzoom")
zoom = minzoom + 1 if minzoom == 0 else minzoom
bands = r.get("band_metadata")

print("Bounds:", bounds)
print("Zoom:", zoom)
print("Data type:", r.get("dtype"))
print("Bands:", bands)
Bounds: [-163.51338693693168, 67.17121197506852, -162.6566451826878, 67.49580310072406]
Zoom: 8
Data type: float32
Bands: [['b1', {}], ['b2', {}], ['b3', {}], ['b4', {}], ['b5', {}]]
[13]:
from shapely.geometry import box

polygon = box(*bounds)
center = (polygon.centroid.y, polygon.centroid.x)
print("Center:", center)
Center: (67.33350753789628, -163.0850160598097)
[ ]:
# import stac_ipyleaflet

m = stac_ipyleaflet.StacIpyleaflet(zoom=zoom, center=center)
m.add_layer(custom_layer)
m
m.remove_layer(custom_layer)