Visualizing Rasters with MosaicJSON using stac_ipyleaflet
Authors: Grace Llewellyn (JPL), Emma Paz (Development Seed)
Date: September 26, 2023
Description: In this notebook, we create a mosaic from file URLs using MosaicJSON, upload it to MAAP’s TiTiler, and then visualize the mosaic using stac_ipyleaflet.
Run This Notebook
To access and run this tutorial within MAAP’s Algorithm Development Environment (ADE), please refer to the “Getting started with the MAAP” section of our documentation.
Disclaimer: Currently, the stac_ipyleaflet works within this Algorithm Development Environment. It is recommended to run this tutorial within MAAP’s ADE Pangeo workspace, which already includes the stac_ipyleaflet package.
Additional Resources
stac_ipyleaflet DOI: 10.5281/zenodo.10015863
Import and Install Packages
To import and install the packages necessary for the notebook, run the following cell.
[ ]:
%pip install cogeo_mosaic --quiet

import os
import boto3
import httpx
from cogeo_mosaic.mosaic import MosaicJSON
from shapely.geometry import box
from ipyleaflet import TileLayer
import stac_ipyleaflet
Setup
First, we’ll set variables and helper functions, including setting the MAAP TiTiler endpoint.
[ ]:
titiler_url = "https://titiler.maap-project.org"
min_zoom = 0
max_zoom = 0
band_min = 0
band_max = 4000
user = os.getenv('JUPYTERHUB_USER')
bucket = "maap-ops-workspace"
color_map = "gist_earth_r"
[3]:
def checkFilePath(file_path):
    result = s3.list_objects(Bucket=bucket, Prefix=file_path)
    exists = True if 'Contents' in result else False
    if exists:
        print('PATH EXISTS')
        return [i for i in result['Contents'] if i["Key"].endswith('.tif')]
    return exists
Find Data Location
Next, we’ll find the location for our data. Sample files are provided in an S3 bucket, but code is also provided for you to uncomment if you will be using your own files.
[4]:
path = "/local/path/to/files/" # "Path to directory with rasters:", Right-click on the directory and select option to Copy Path

s3 = boto3.client('s3')
file_name = path.split('/', 1)[-1]
if 'shared-buckets' in path:
    file_path = f'shared/{file_name}'
if 'my-private-bucket' in path:
    file_path = f'{user}/{file_name}'
if 'my-public-bucket' in path:
    file_path = f'shared/{user}/{file_name}'


# If using your files
#if file_path:
#    paths = checkFilePath(file_path)
#    files = [ i['Key'] for i in paths ]

# Our sample files
files = ['s3://maap-ops-workspace/shared/alexdevseed/landsat8/viz/Landsat8_30542_comp_cog_2015-2020_dps.tif', 's3://maap-ops-workspace/shared/alexdevseed/landsat8/viz/Landsat8_30543_comp_cog_2015-2020_dps.tif']

print(files)
['s3://maap-ops-workspace/shared/alexdevseed/landsat8/viz/Landsat8_30542_comp_cog_2015-2020_dps.tif', 's3://maap-ops-workspace/shared/alexdevseed/landsat8/viz/Landsat8_30543_comp_cog_2015-2020_dps.tif']
Get Raster Info
Let’s go ahead and get our raster information which will consist of bounds, zoom, data type, and bands. This information will be pulled from the first file in an array of files.
[5]:
url = files[0]

r = httpx.get(
    f"{titiler_url}/cog/info",
    params = {
        "url": url,
    }
).json()

if r.get('count') > 0:
    bounds = r.get("bounds")
    min_zoom = r.get("minzoom")
    max_zoom = r.get("maxzoom")
    zoom = min_zoom + 1 if min_zoom == 0 else min_zoom
    bands = r.get("band_metadata")

    print("Bounds:", bounds)
    print("Zoom:", zoom, "min =", min_zoom, "max =", max_zoom)
    print("Data type:", r.get("dtype"))
    print("Bands:", bands)
Bounds: [-117.10749852280769, 50.78795362739066, -116.50936927974429, 51.16389512140189]
Zoom: 9 min = 9 max = 12
Data type: float32
Bands: [['b1', {}], ['b2', {}], ['b3', {}], ['b4', {}], ['b5', {}], ['b6', {}], ['b7', {}], ['b8', {}], ['b9', {}], ['b10', {}], ['b11', {}], ['b12', {}], ['b13', {}], ['b14', {}], ['b15', {}], ['b16', {}], ['b17', {}], ['b18', {}]]
Create Mosaic
Using MosaicJSON, we’ll create a mosaic from the file urls.
[6]:
if min_zoom == 0 and max_zoom == 0:
    print("Warning: missing zoom attributes!")

mosaicdata = MosaicJSON.from_urls(files, minzoom=min_zoom, maxzoom=max_zoom)
print("Mosaic created!")
Mosaic created!
Upload the MosaicJSON
Next, let’s upload the MosaicJSON to the TiTiler…
[7]:
mosaic_links = httpx.post(
    url=f"{titiler_url}/mosaics",
    headers={
        "Content-Type": "application/vnd.titiler.mosaicjson+json",
    },
    json=mosaicdata.model_dump(exclude_none=True),
).json()
# print(mosaic_links)
… and then filter for tilejson results so we get the tilejson endpoint.
[8]:
tilejson_object = list(
    filter(lambda x: x.get("rel") == "tilejson", dict(mosaic_links)["links"])
)
tilejson_url = tilejson_object[0]["href"]
tilejson_url
[8]:
'https://titiler.maap-project.org/mosaics/9e6ff907-589b-42b3-9e5b-46d455af5afe/tilejson.json'
Calculate Raster Center
For this next step, we’ll calculate the raster center for map placement.
[9]:
r = httpx.get(tilejson_url).json()
center_data = r.get('center')
center = (center_data[1], center_data[0])
zoom = center_data[2]
[10]:
polygon = box(*bounds)
center = (polygon.centroid.y, polygon.centroid.x)
print("Center:", center)
Center: (50.97592437439628, -116.80843390127599)
Create the TileLayer
Before visualization, we’ll set our parameters and create our tile layer.
[11]:
params = {
    "return_mask": "true",
    "rescale": f"{band_min}, {band_max}",
    "bidx": "1",
    "colormap_name": "viridis"
}

r = httpx.get(tilejson_url, params=params).json()

layer_url = r['tiles'][0]
custom_layer = TileLayer(url=layer_url, show_loading=True, transparent=True)
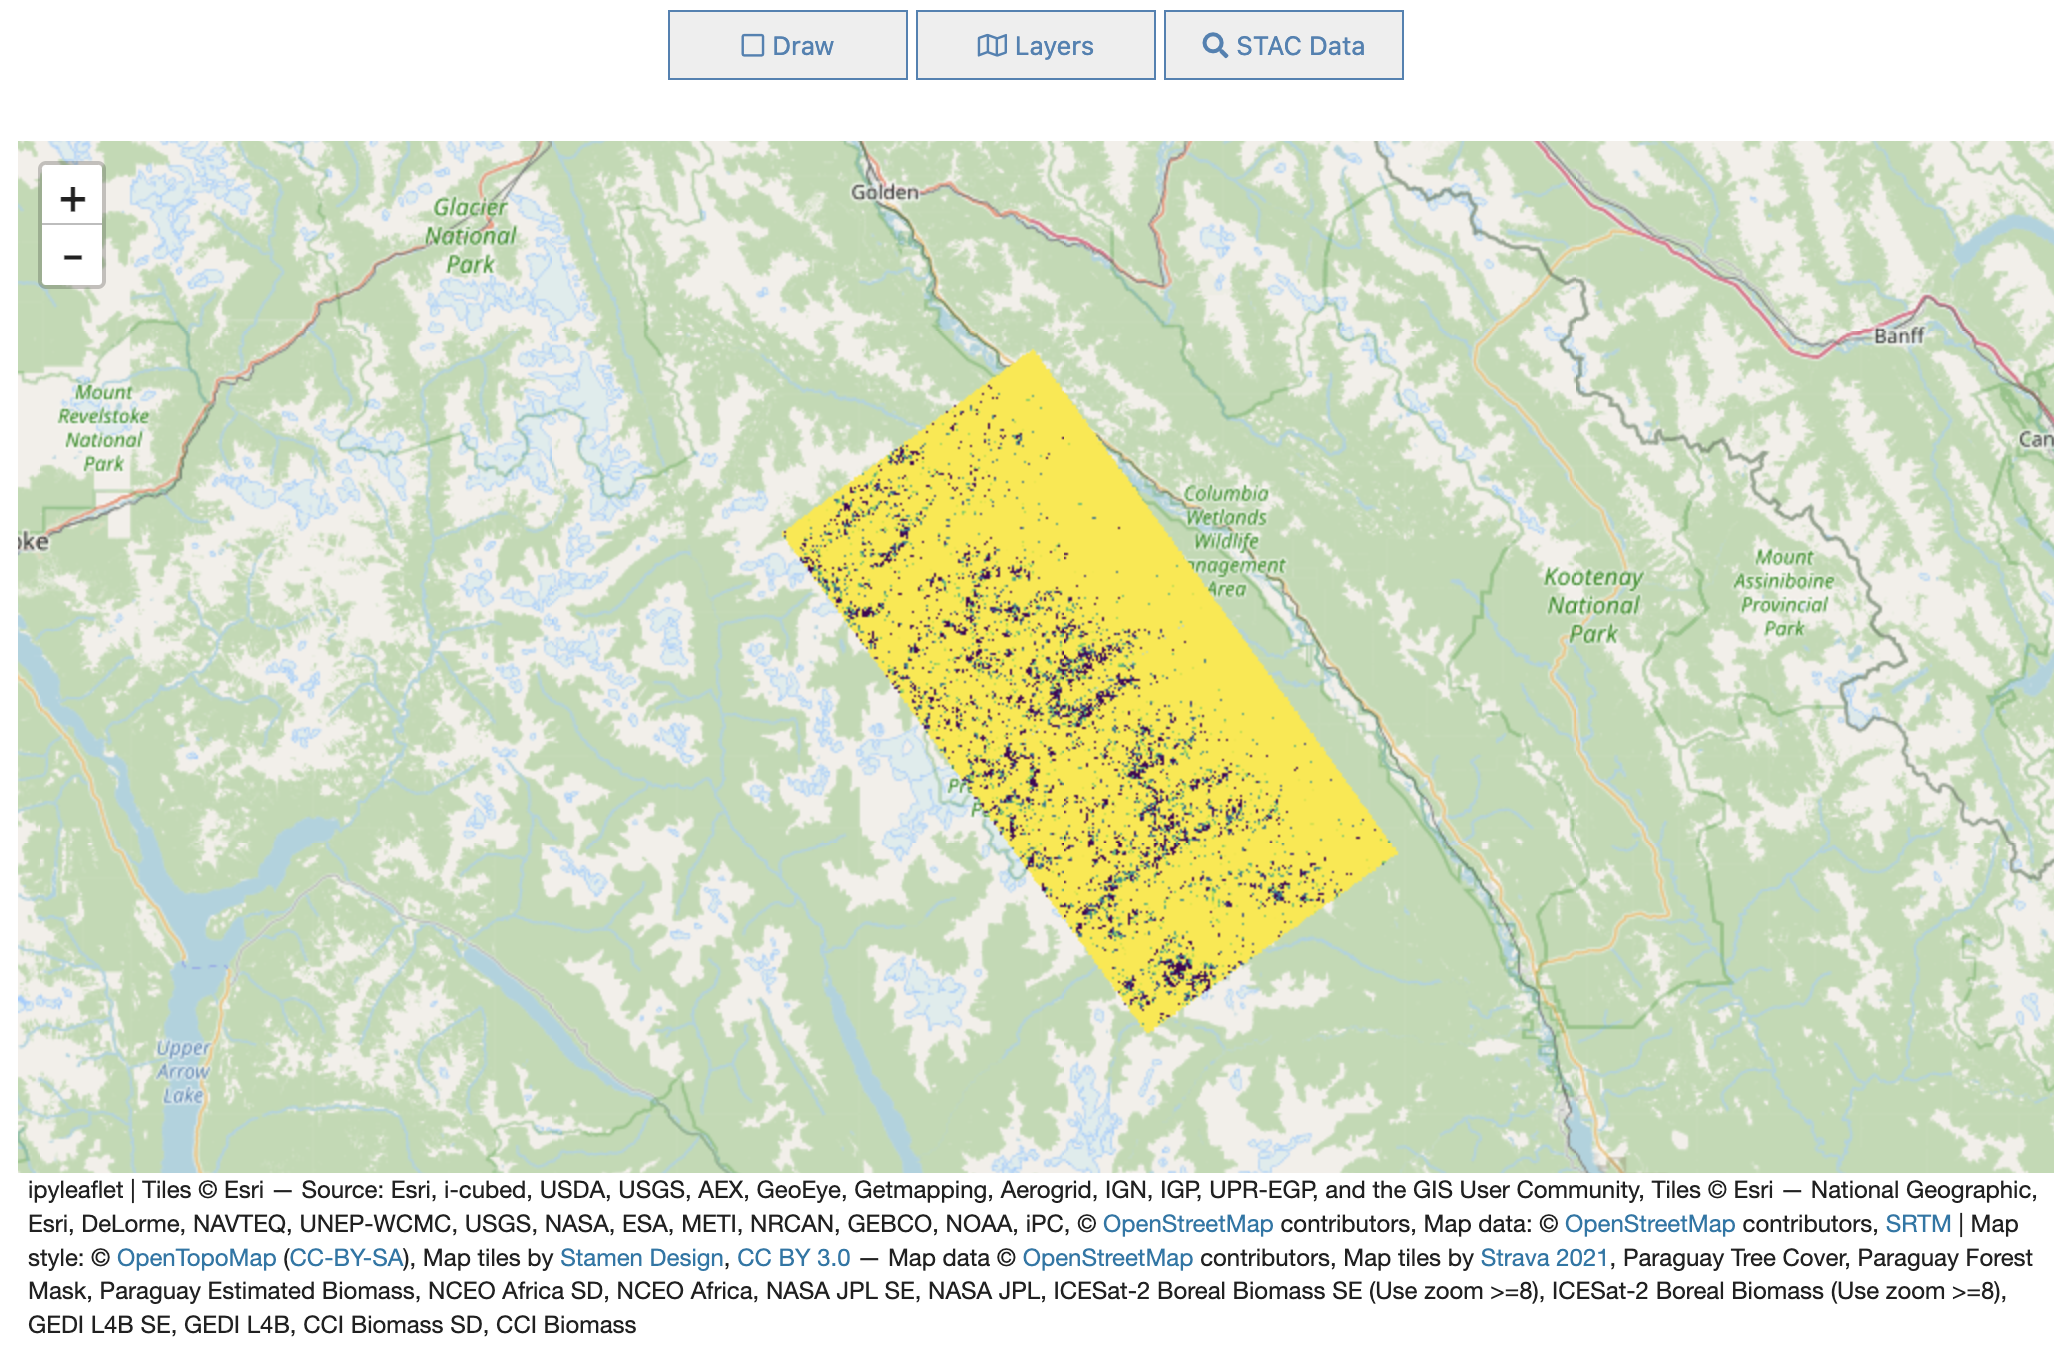
Add the Mosaic Tile Layer to the Map
Finally, using stac_ipyleaflet, we’ll set our map center and zoom and then add our mosaic tile layer.
[ ]:
m = stac_ipyleaflet.StacIpyleaflet(zoom=zoom, center=center)
m.add_layer(custom_layer)
m